
| 🏠 | APX Prices | NBP Gas | Power (2014->) | Power (LIVE) | Power Forecasting | Power Revenues | Renewables | Spectron Prices | BETA (NEW) |
iPhone App User Guide
Introducing the NETA Reports iPhone App
Using the existing report functionality of the NETA Reports it has been possible to create a client for the iPhone that allows a user to download and view reports on the go. This page gives an overview of the functionality and a guide to use.
If you have a problem then log a support on the support page.
To download the app visit the EnAppSys Apple App Store Page
To use the app you need to:
- create a report as usual,
- start the app on your device,
- login and
- select and view the report.
As a guest user you can view the most recent free reports.
Starting up
When you first start the app you will be presented with a splash screen and then the authentication screen.
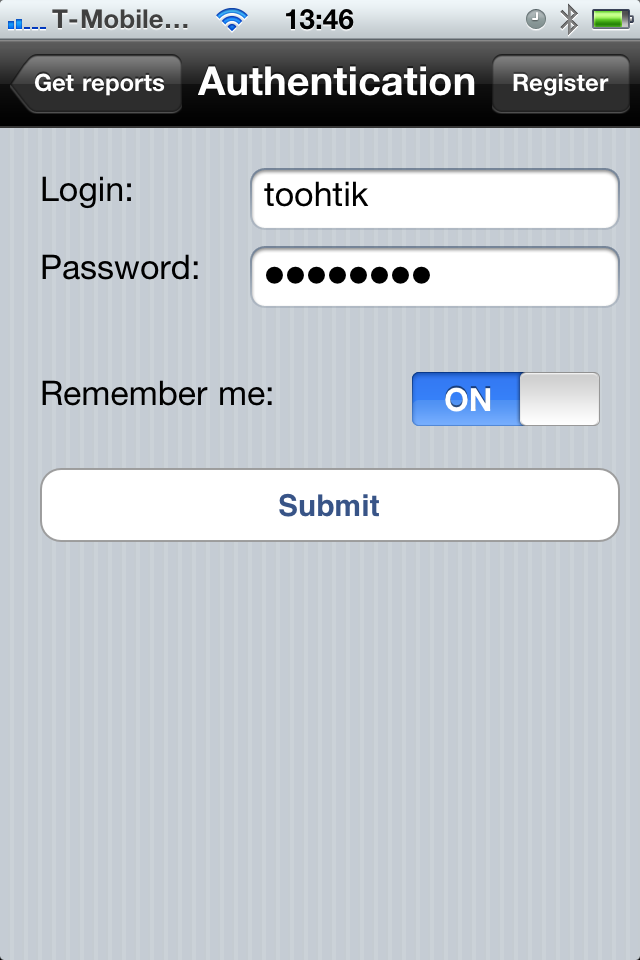
Type your username and password into the authentication screen and click submit. If you want to avoid doing this every time you use the app you can flick the "Remember Me" switch.
If you are not a user of NETA Reports you can register to view data using the register screen which is accessible by clicking the "Register" button on the authentication screen. The register screen is as shown below, touching the "i" icon on the iPhone will tell you more about the requirements for each field.

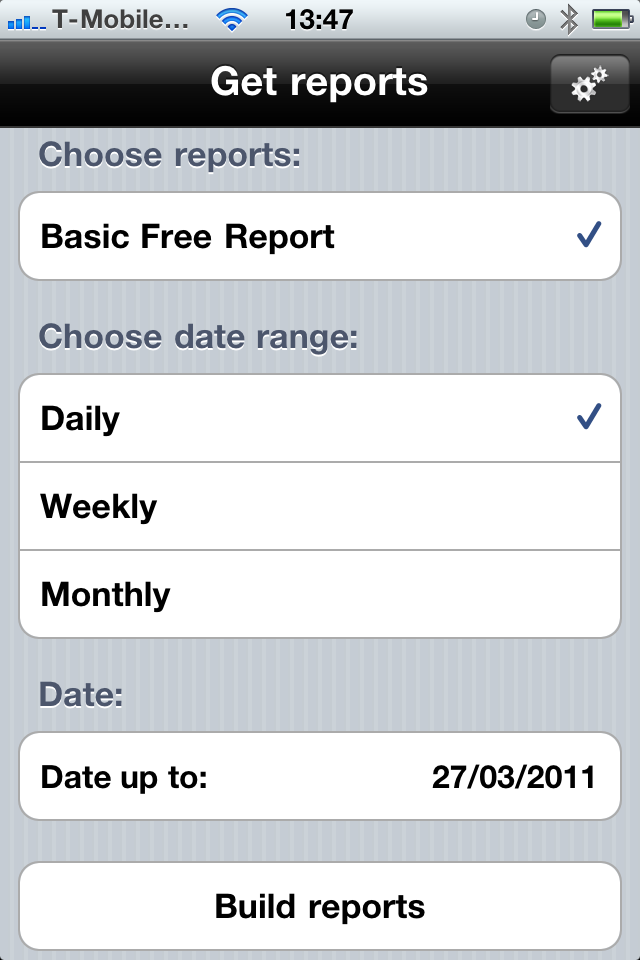
Selecting a Report
To select a report, choose the report you want to view, the free reports will be available for all users. Select the date range type for the report. If you have sufficient privileges you will be able to change the date to select a date for your report. By default the most recent report is available but data can go back to January 2002. Tap the build reports button to build the reports.
Viewing Your Data
The app on your device will go to the server and download the data. It may take some time depending on the size of your report or the quality of your connection.
All charts have the following functionality:
- Click the "i" button for a description of the chart.
- The title of the chart is just above the chart.
- The name of the report the chart belongs to is at the top of the screen.
- Touch a segment on the screen to get the precise detail on a segment of the chart.
Below are examples of the kind of charts that you can view.
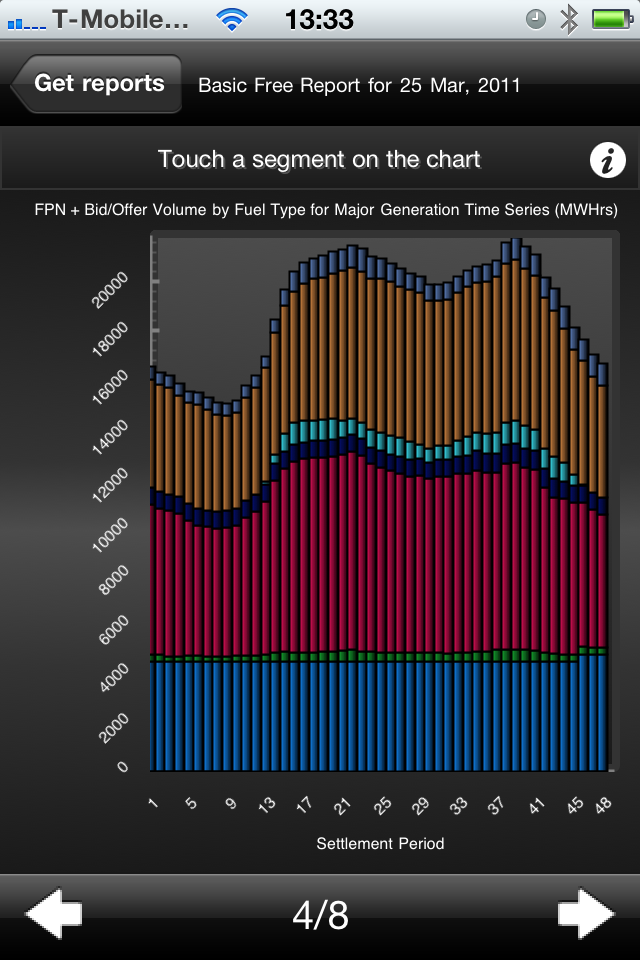
- The first chart is from the free report and shows the generation fuel mix for the UK by half hour for 25th March, 2011.
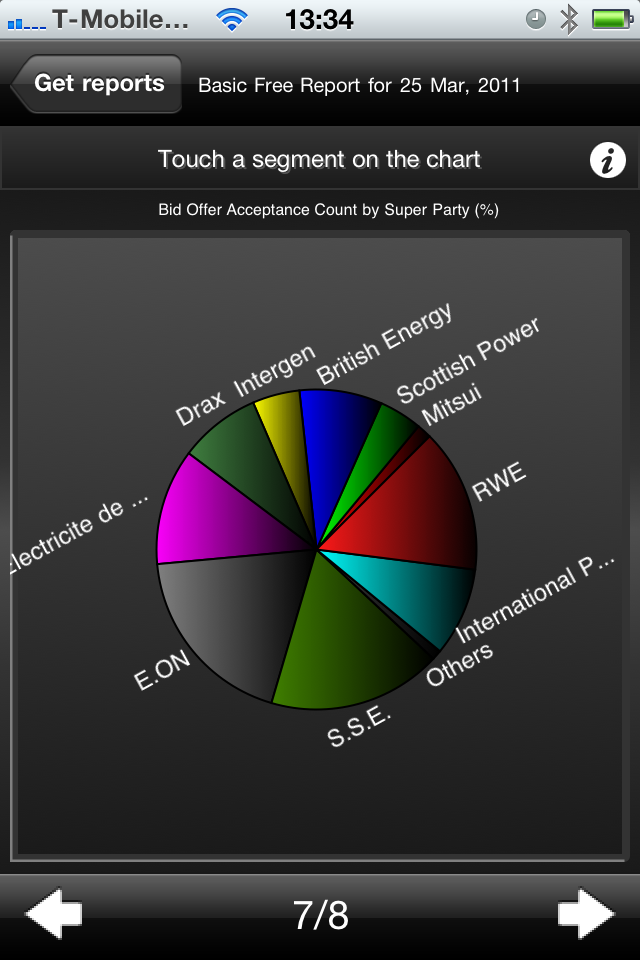
- The second chart is from the free report and shows the activity in the balancing mechanism for each major participant in the UK for the 25th March, 2011.
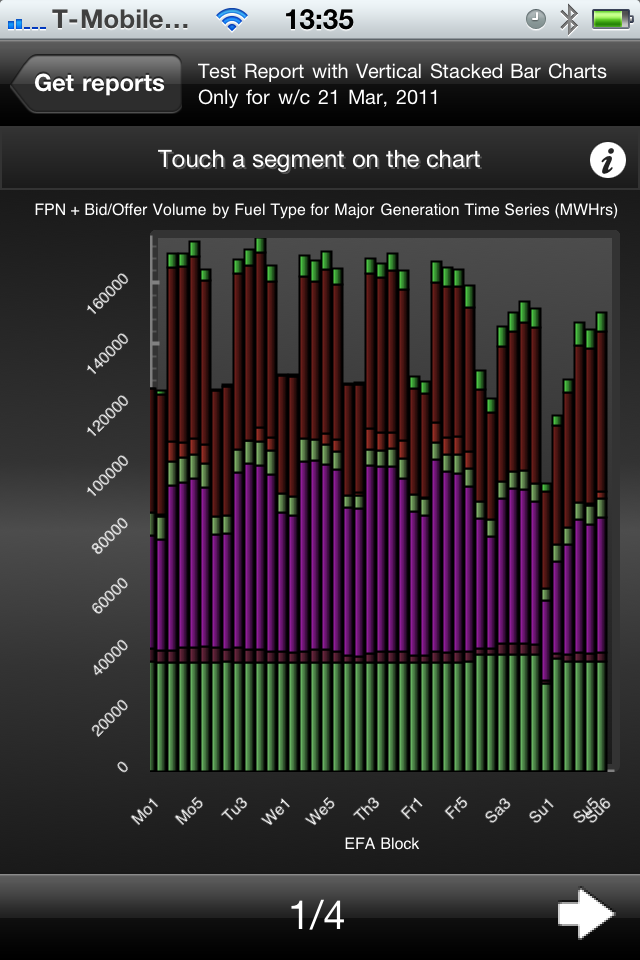
- The third chart is from a user configured report and shows the generation fuel mix for the UK by 4 hour EFA block for a week.
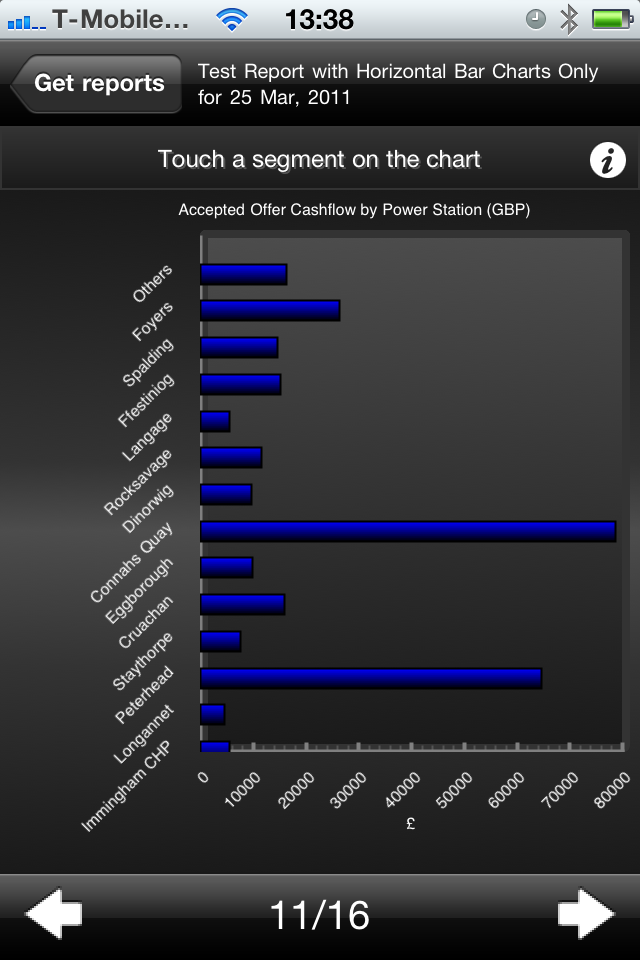
- The final chart shows the offer cashflow in the balancing mechanism for power stations for 25th March, 2011.